MICAlgo 中文版
HomeForex - ExnessCrypto - Bybit
  • 🏠Home
  • 🟢開始使用
    • 為什麼使用 MICAlgo?
      • 怎麼運作的
      • 我們提供什麼
  • 🛠️什麼是TradingView?
  • 💰推薦交易所
  • 💵米克交易指標
    • 安裝和設置
      • 怎麼安裝MICAlgo 交易指標
      • 開始使用前
      • 怎麼設置快訊
      • 如何更新指標
      • 風險管理
    • ⚙️MICAlgo Premium 中文版
    • ⚙️Smart Money Concept
    • ⚙️AI 震盪指標 [MICAlgo]
  • 📗學習資源
    • 📜傳統技術分析
      • 價格行為
      • 趨勢分析
      • Support and Resistance
      • Volume Analysis
      • Chart Patterns
        • Continuation Pattern
          • THREE RISING VALLEYS
          • THREE FALLING PEAKS
          • BEARISH PENNANT
          • BULLISH PENNANT
          • BEARISH FLAG
          • BULLISH FLAG
          • CUP AND HANDLE
          • CUP AND HANDLE (MIRRORED)
        • Reversal Pattern.
          • HEAD AND SHOULDERS
          • HEAD AND SHOULDERS (MIRRORED)
          • DOUBLE TOP
          • DOUBLE BOTTOM
          • DIAMOND (TOP)
          • DIAMOND (BOTTOM)
          • BROADENING (BOTTOM)
          • BROADENING (TOP)
          • BUMP AND RUN (BOTTOM)
          • BUMP AND RUN (TOP)
        • Bilateral Patterns
          • SYMMETRICAL TRIANGLE
          • RISING WEDGE
          • FALLING WEDGE
          • DESCENDING TRIANGLE
          • ASCENDING TRIANGLE
          • ROUNDING TOP
          • ROUNDING BOTTOM
          • RECTANGLE (BOTTOM)
          • RECTANGLE (TOP)
          • BROADENING (HORIZONTAL SUPPORT)
          • BROADENING (HORIZONTAL SUPPORT)
          • BROADENING (HORIZONTAL RESISTANCE)
          • BROADENING WEDGE (ASCENDING)
          • BROADENING WEDGE (DESCENDING)
      • Candle Patterns
        • BULLISH ENGULFING
        • DARK CLOUD COVER
        • ADVANCE BLOCK
        • BEARISH ENGULFING
        • EVENING STAR
        • PIERCING
        • THREE BLACK CROWS
        • TRI-STAR (TOP)
        • TRI-STAR (BOTTOM)
        • DOJI
        • GRAVESTONE DOJI
        • DRAGONFLY DOJI
        • HAMMER
        • INVERTED HAMMER
        • RISING THREE METHODS
        • FALLING THREE METHODS
        • TWEEZER (TOP)
        • TWEEZER (BOTTOM)
        • SHOOTING STAR
        • HANGING MAN
        • THREE WHITE SOLDIERS
        • BULLISH BELT HOLD
        • BEARISH BELT HOLD
        • MORNING STAR
        • SPINNING TOPS (TOP)
        • SPINNING TOPS (BOTTOM)
        • TOWER (TOP)
        • TOWER (BOTTOM)
      • Elliott Wave Theory
      • Fibonacci
    • 🧠SMC Education
      • Structure
      • Break Of Structure (BOS)
      • Swing High and Swing Low
      • Types of structure
      • The Fibonacci
      • The Liquidity
      • Trendline
      • Imbalance/Fair Value Gap (FVG)
      • The Orderblock
      • Mitigating block
      • Session
      • Risk Management
  • 🏠Home
Powered by GitBook
On this page
  • Swing structure
  • Failure Swing
  • Working with timeframes
  • Identification of structural elements and structure break
  • The first method - Сonservative
  • The second method - Average
  1. 學習資源
  2. SMC Education

Types of structure

PreviousSwing High and Swing LowNextThe Fibonacci

Swing structure

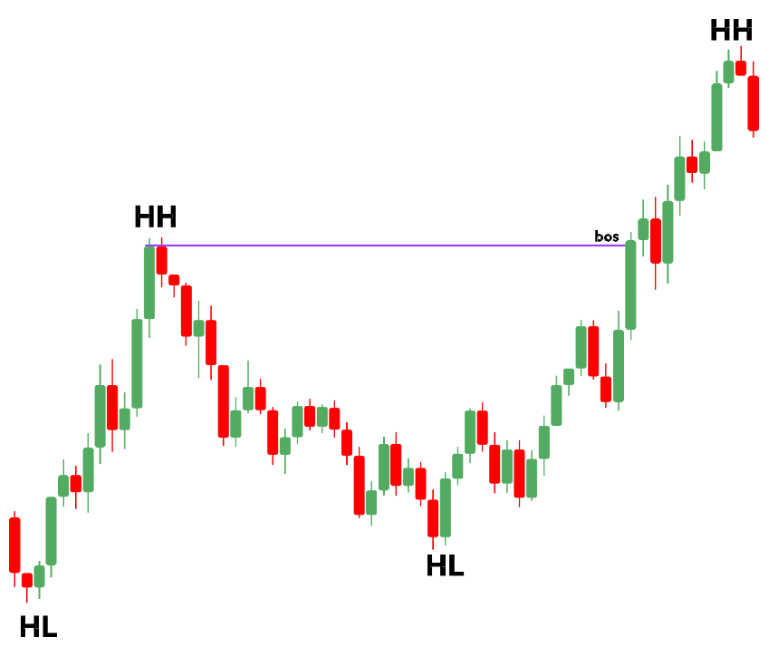
Swing structure - a standard structure whose significant elements (HH, HL, HL, LL) forms the general direction of the price

Substructure - a corrective movement within a standard (swing) structure. This structure forms (HL) for an uptrend, and (LH) for a downtrend.

Minor structure - swings (highs and lows) in the direction of the general price direction inside the swing structure. The movement from (HL) to (HH) on the uptrend, and the movement from (LH) to (LL) on the downtrend is a Minor structure

MBOS - minor bos - breakdown of minor structure by substructure

Failure Swing

SMS - shift in market structure. The case when the primary trend can not reach the new (HH) on an uptrend or the new (LL) on a downtrend. This tells us about the beginning of a corrective movement - substructure.

On a high timeframe it is a corrective movement, while on a lower timeframe it is the beginning of a new trend.

In the example above, the general direction of the asset is uptrend. Subsequently, the price failed to update the previous (HH), and started a local downtrend (substructure) to overlap the imbalance and test the support zone, after which the (HL) was formed, and after (HH), and the uptrend continued.

Also with an example of a downtrend swing. A rising substructure was formed, which formed (LH), after which a new (LL) was formed, and the downtrend continued.

Working with timeframes

Effective use of the structure is possible when analyzing the chart from higher timeframes to lower timeframes. To determine the general direction of the price, it is sufficient to analyze the five main timeframes. Higher timeframes are always in priority.

The main timeframes:

1 month, 1 week, 1 day, 4 hours, 1 hour 15m - 5m - to open the position

During the formation of (HL) after (HH) on 1W, most likely on the timeframes 1D, 4H, 1H the trend will change to a downtrend (substructure), and after the formation of (HL) when the price will test support area, the structure on these timeframes will synchronize again (minor structure)

Identification of structural elements and structure break

The first method - Сonservative

Structure identification: candlestick body

Structure break: candlestick body

The second method - Average

Most common

Structure identification: candlestick shadow

Structure break: candlestick body

📗
🧠